Supplemental Poster info
Prepared for ESA 2020
|
Supplemental Information
Background pdf Methods pdf
Additional Results:
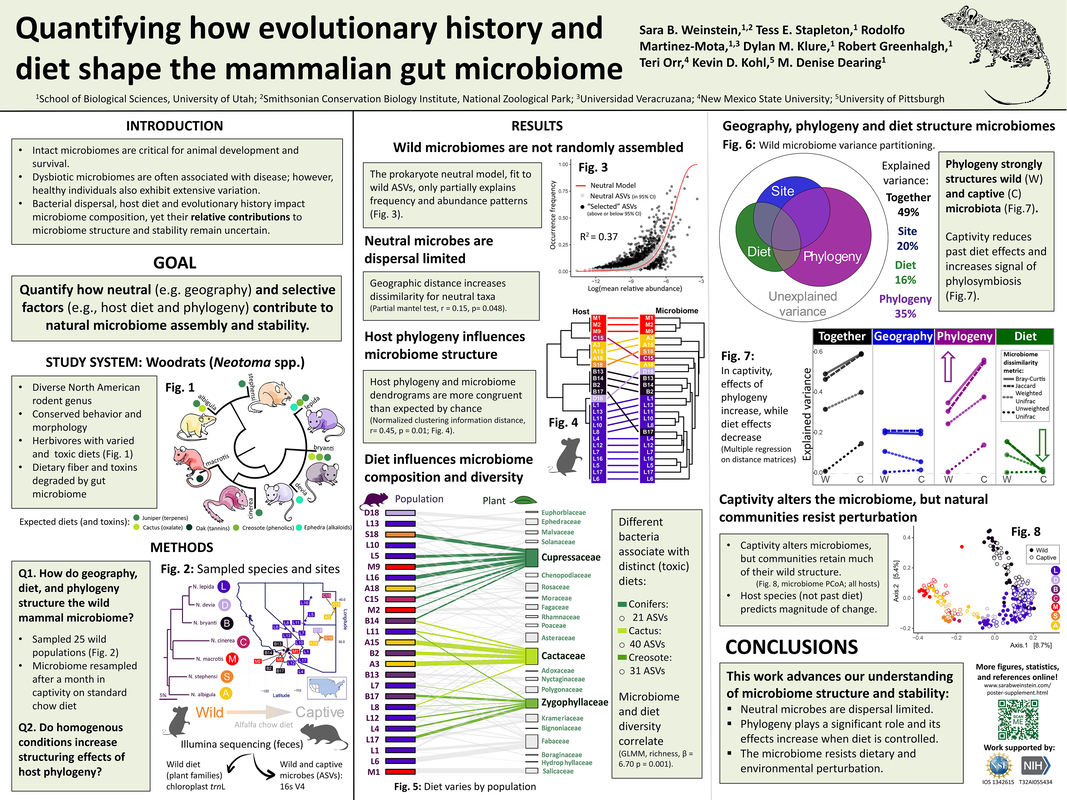
Diet and microbiome diversity correlate: Supplemental Figure 1. Natural diets and diet diversity vary between wild Neotoma populations, with seven populations exhibiting dietary specialization (A). Microbiome diversity (observed ASVs) was correlated with diet diversity (observed plant families), shown as a single regression line for all species (B). Captivity alters the microbiome: Supplemental Figure 2: (A) Captivity substantially altered the gut microbiome. (A) Within a population, individuals (represented by distinct letter code) showed consistent community shifts. Population S18 is shown here, see supplementary material for the other 22 populations. (B) Captive samples clustered with wild and, (C) although individuals retained < 50% of their wild ASVs when resampled in captivity, (D) across all animals, > 90% of wild ASVs were detected in captivity. Animals varied in their response to captivity, with different species exhibiting significantly different sensitivity to this disturbance, measured as either pair-wise Bray-curtis dissimilarity (E) or percent change in observed ASVs (F). Significant differences in responses are indicated with letter codes. Captivity increases phylosymbiosis Supplemental Figure 3. A. Host phylogeny is a significant structuring factor for woodrat microbiomes. Congruence between host evolutionary history and microbiome composition (aka phylosymbiosis) is present in wild populations (A. Wild host-microbiome tanglegram, B. PCoA plot) and become even stronger when differences in environment and diet are removed in captivity (C. Captive PCoA, D. Tanglegram). Microbiome clustering is based on Bray-Curtis distances. |


